

Fits a crescent model to visibility amplitude data using the deo tempering sampler with the stan exploration kernel. This is a validation and test for it. More...
#include "data_visibility_amplitude.h"#include "model_image_crescent.h"#include "model_ensemble_averaged_scattered_image.h"#include "likelihood.h"#include "sampler_stan_adapt_diag_e_nuts_MCMC.h"#include "sampler_deo_tempering_MCMC.h"#include "utils.h"
Functions | |
| int | main (int argc, char *argv[]) |
Detailed Description
- Date
- April, 2020
Compares a geometric crescent model to the visibility amplitude data taken in 2007 and 2009, permitting a day-specific intensity renormalization. The primary fit result is a measure of the size ( \( R \)), the relative thickness ( \( \psi \)), and the degree of symmetry ( \( \tau \)) of the emission region and can be compared to the fit results reported in Kamruddin and Dexter 2013.
The resulting parameter distribution is:
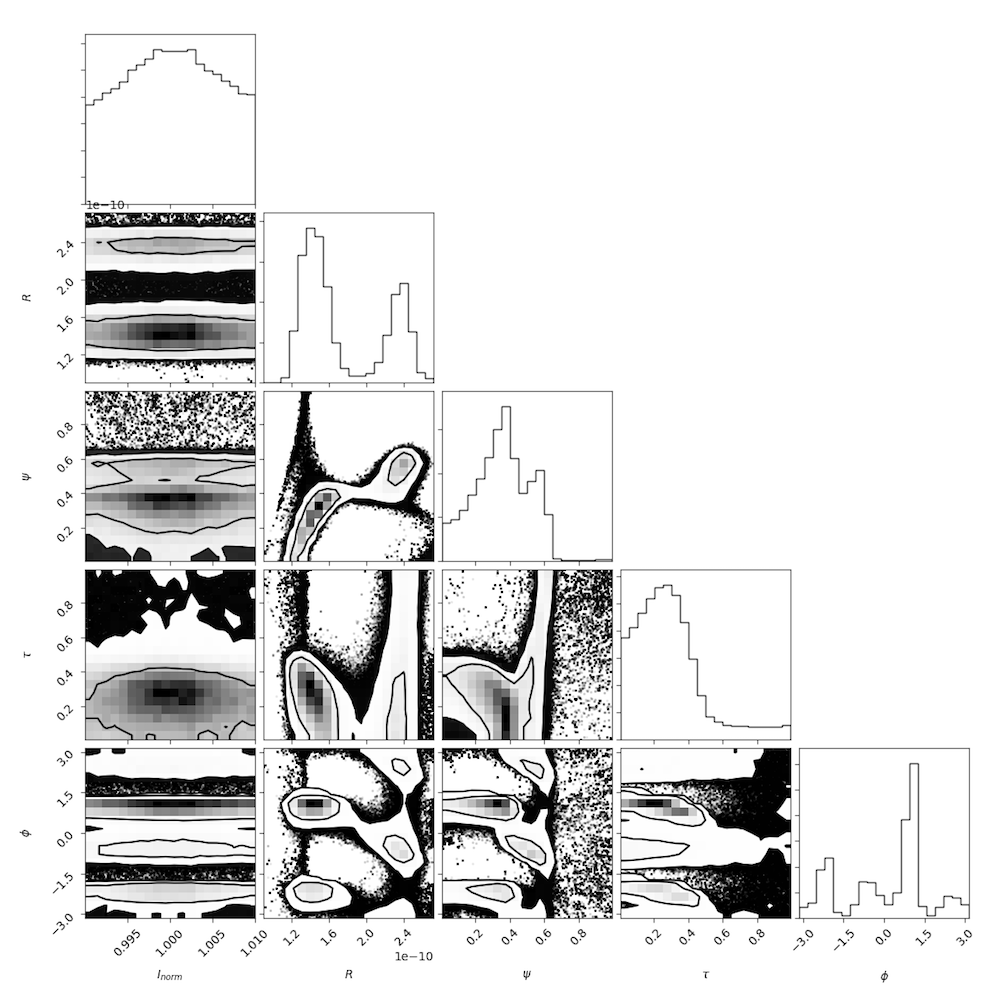
Note that the intensity normalization is solved for analytically in the likelihood_marginalized_visibility_amplitude, and thus the intrinsic normalization is fixed near unity by design.
- Date
- April, 2020
Compares a geometric crescent model to the visibility amplitude data taken in 2007 and 2009, permitting a day-specific intensity renormalization. The primary fit result is a measure of the size ( \( R \)), the relative thickness ( \( \psi \)), and the degree of symmetry ( \( \tau \)) of the emission region and can be compared to the fit results reported in Kamruddin and Dexter 2013.
The resulting parameter distribution is:
Note that the intensity normalization is solved for analytically in the likelihood_marginalized_visibility_amplitude, and thus the intrinsic normalization is fixed near unity by design.
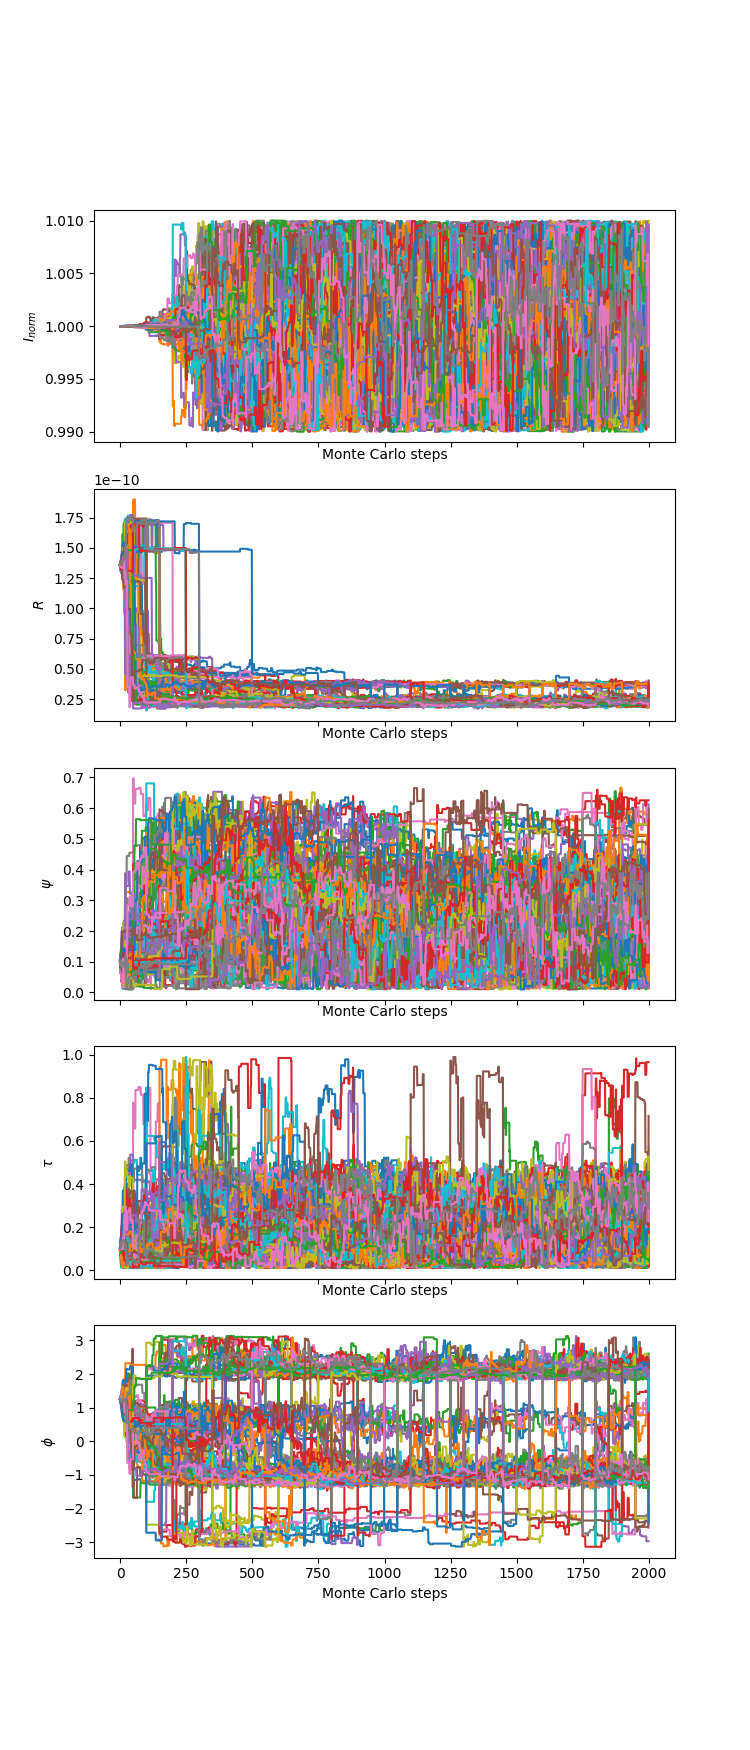
The parameter values associated with the individual chains are:
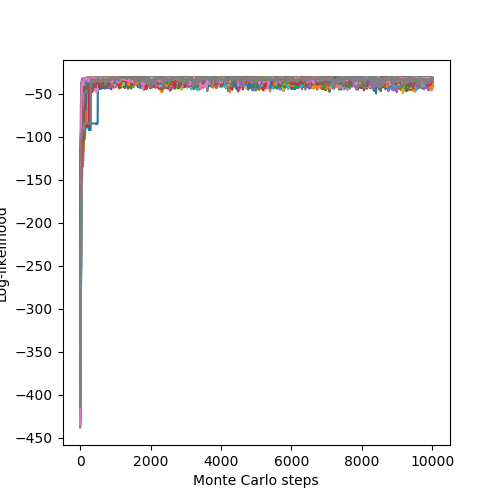
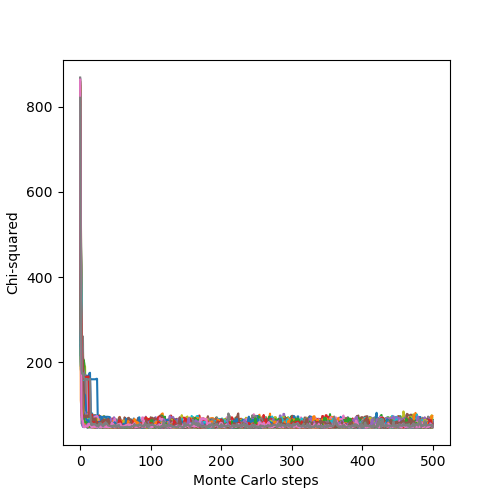
The associated likelihoods and \(\chi^2\) of the chains are:
- See also
- See reading_data.cpp example for details on reading in EHT data.