Fits a symmetric Gaussian model to visibility amplitude data for validation purposes. More...
#include "data_visibility_amplitude.h"#include "model_symmetric_gaussian.h"#include "model_ensemble_averaged_scattered_image.h"#include "likelihood.h"#include "sampler_affine_invariant_tempered_MCMC.h"#include "utils.h"#include <mpi.h>#include <memory>#include <string>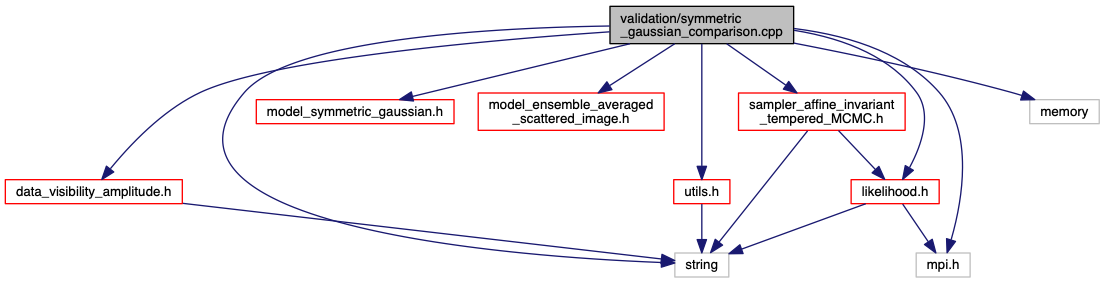
Functions | |
| int | main (int argc, char *argv[]) |
Detailed Description
- Date
- June 2017
Compares a symmetric Gaussian model to the visibility amplitude data taken in 2007 and 2009, permitting a day-specific intensity renormalization. The primary fit result is a measure of the size of the emission region and can be compared to the fit results reported in Broderick et al. (2011) (see, especially, Fig. 4). The resulting parameter distribution is:
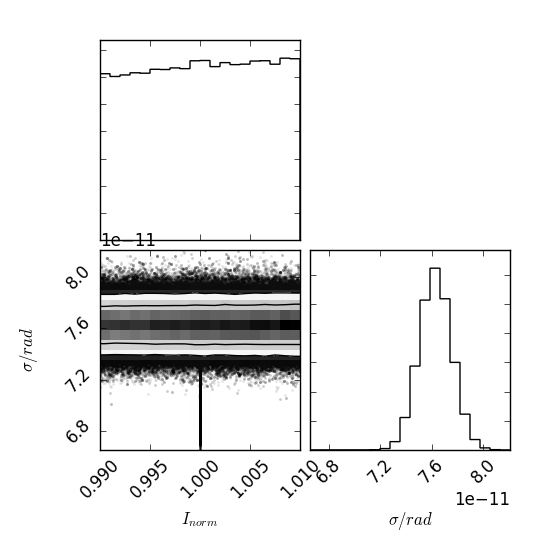
Note that the intensity normalization is solved for analytically in the likelihood_marginalized_visibility_amplitude, and thus the intrinsic normalization is fixed near unity by design. The size (std. dev.) of the Gaussian, \(\sigma\), is given in radians; \(7.6\times10^{-11}~{\rm rad}=15.7~\mu{\rm as}\), and thus the recovered probability distribution quantitatively matches the best fit size in Broderick et al. (2011), \(\sigma=15.8\pm0.2~\mu{\rm as}\) very well.
The parameter values associated with the individual chains may also be plotted:
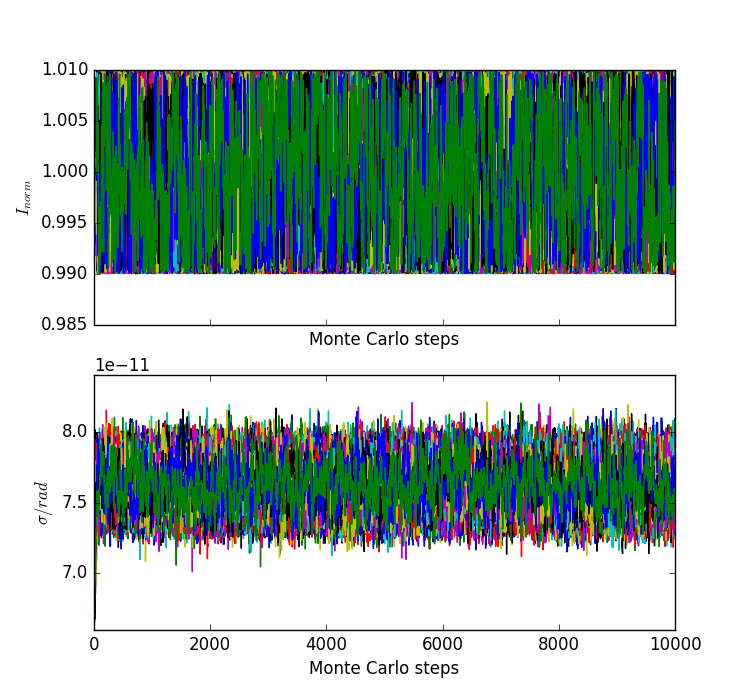
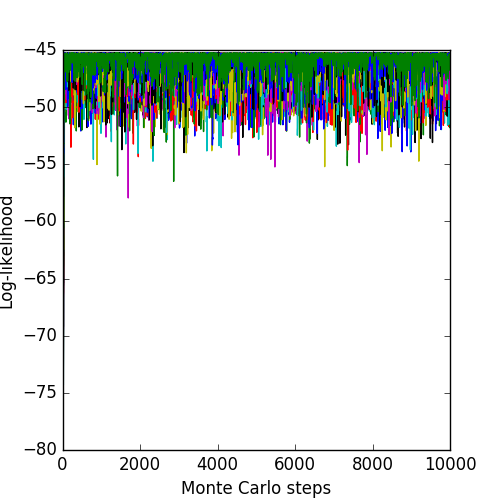
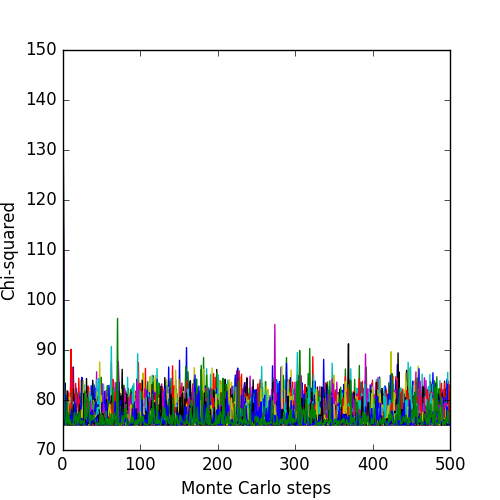
Again, the intensity normalization is pinned near unity. The size of the Gaussain rapidly finds the minimum and the probability distribution of steps converges. The associated log-likelihoods and \(\chi^2\) of the chains are: