

Fits an asymmetric Gaussian model to visibility amplitude data for validation purposes. More...
#include "data_visibility_amplitude.h"#include "model_image_asymmetric_gaussian.h"#include "model_ensemble_averaged_scattered_image.h"#include "likelihood.h"#include "sampler_affine_invariant_tempered_MCMC.h"#include "utils.h"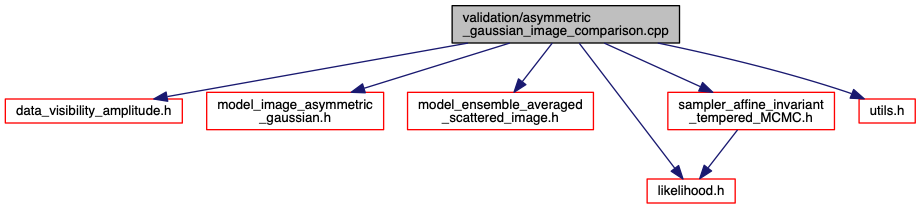
Functions | |
| int | main (int argc, char *argv[]) |
Detailed Description
- Date
- July 2017
Compares an asymmetric Gaussian model to the visibility amplitude data taken in 2007 and 2009, permitting a day-specific intensity renormalization. The primary fit result is a measure of the size and asymmetry of the emission region and can be compared to the fit results reported in Broderick et al. (2011) (see, especially, Fig. 5). The resulting parameter distribution is:
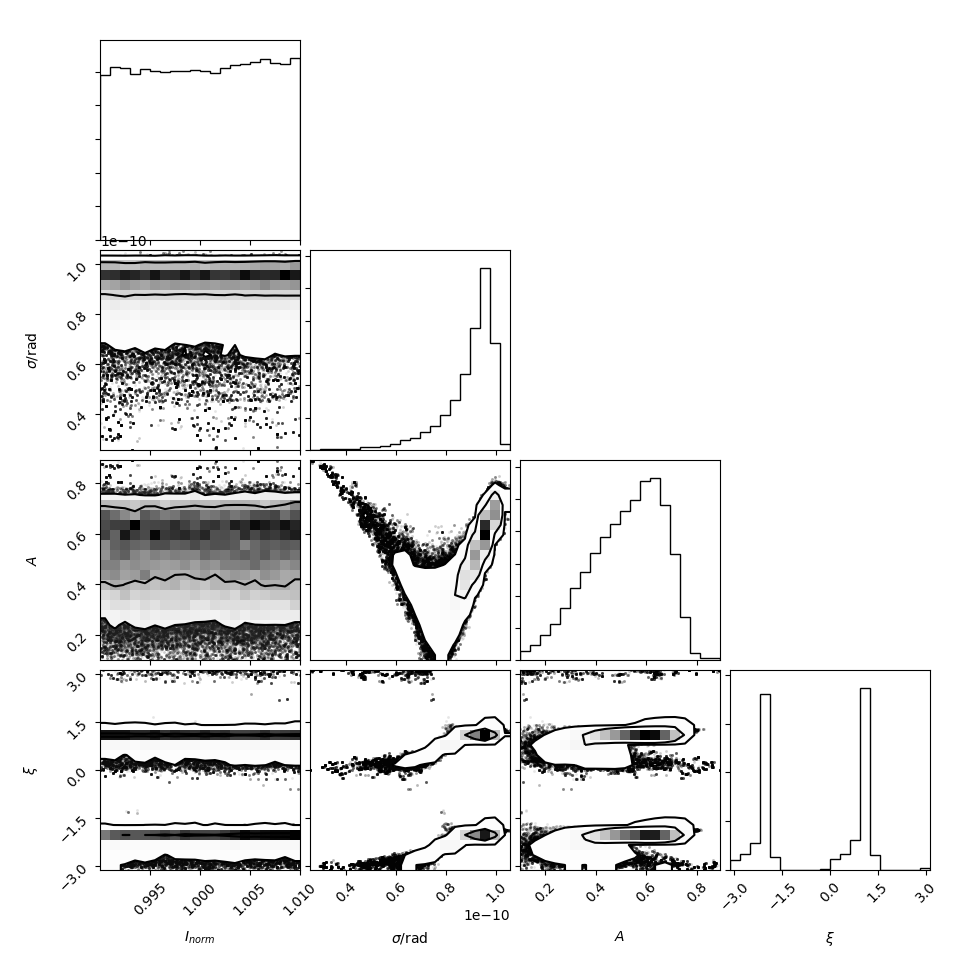
Note that the intensity normalization is solved for analytically in the likelihood_marginalized_visibility_amplitude, and thus the intrinsic normalization is fixed near unity by design. Also, \(9.5\times10^{-9}~{\rm rad}=19.6~\mu{\rm as}\), making the reconstructed \(\sigma\) and \(A\) consistent with those reported in Broderick et al. (2011).
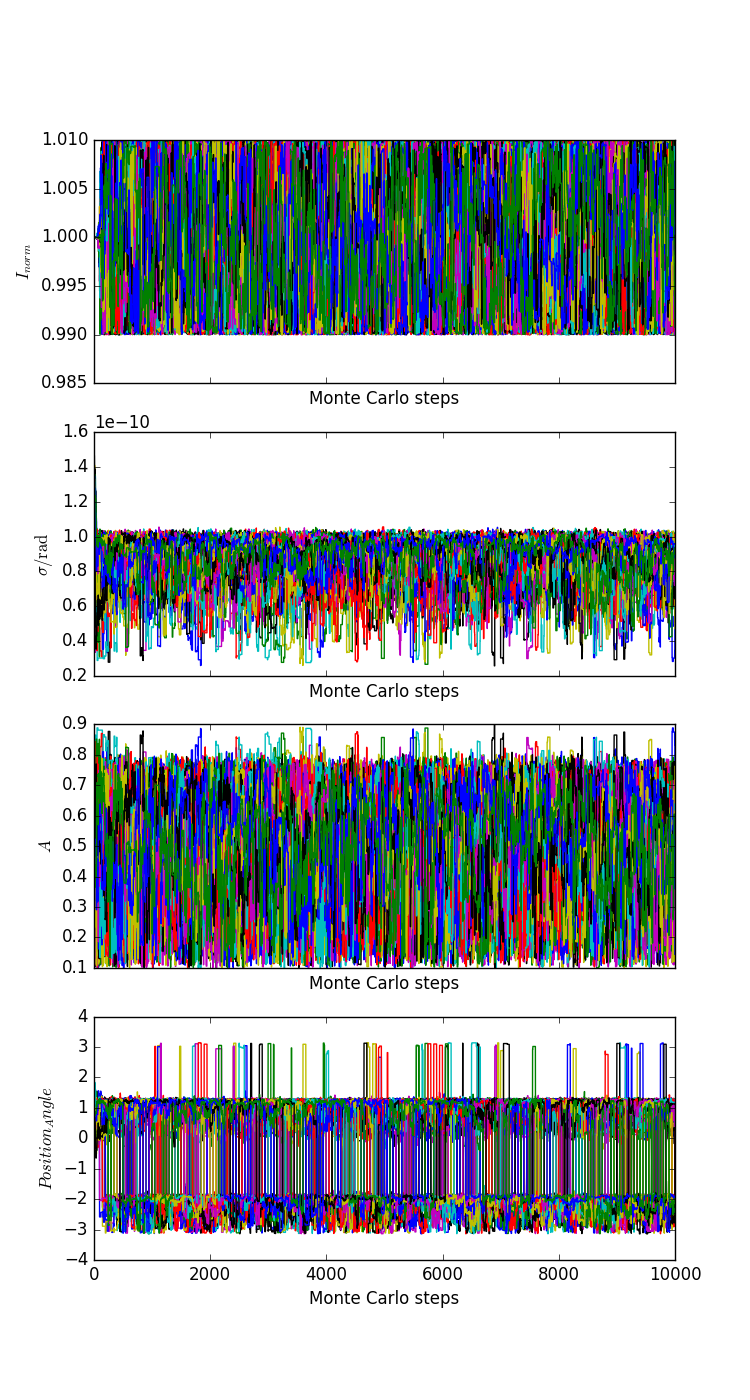
The parameter values associated with the individual chains are:
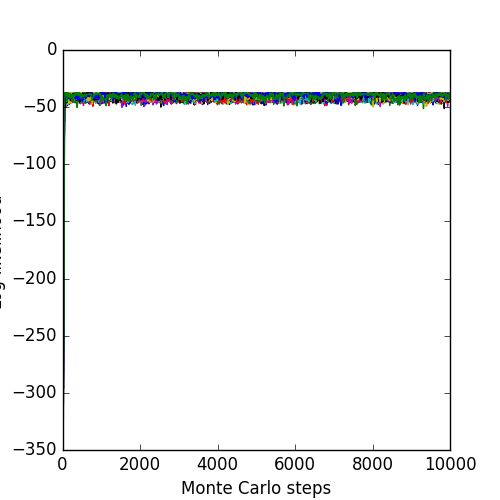
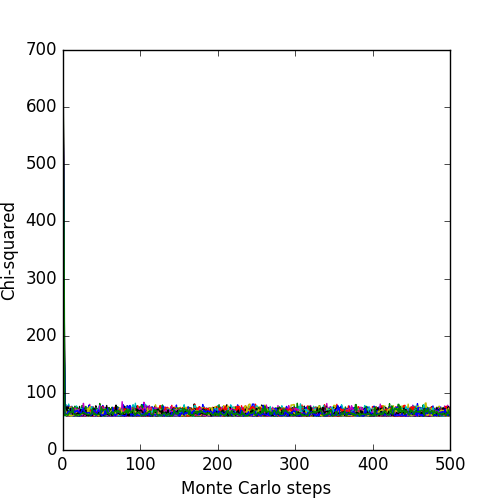
The associated likelihoods and \(\chi^2\) of the chains are:
- See also
- See reading_data.cpp example for details on reading in EHT data.